The general equation of a conic section is shown below :
Ax2 + Bxy + Cy2 + Dx + Ey + F = 0 where

A, B, C, D, E, F are parameters of the equation.
The most simplest conic section is an quadratic function y = x2. In term of the language of 'conic section', an quadratic curve belong to the class of parabola. The equation can be rewrite in the form of a conic section :
x2 - y = 0where the parameters are A = 1, B = 0, C = 0, D = 0, E = -1 and F = 0.
To create this conic section, we uses the function 'gconic' and enters A, B, C, D, E and F as parameters :
Input 1 : a=gconic(1,0,0,0,-1,0)
Ans. set a = 7, 0, 0, 0, 0, 1, 0, 1, 0, 0, 0, -1, 0
The output list represents a conic section. The first element of the list is the geometrical type. The value of 7 means that the object is a parabola. (In the case if it is an ellipse, the value would be 5 and for hyperbola, the value would be 6)
To show that it is indeed a quadratic curve,
Input 2 : draw('a',-5,5,0.1,-2)
Below is the resulting curve 'a' :

There is a problem in using A to F to create a conic section. How can we know their values in the first place ? Fortunately, if the center of the conic section is the origin and the angle of the conic section is either 0 or 90, then the setting of parameters A to F can be quite easy. Below are the diagrams that showing some simply orientated conic section and their equations. The parameters of the equations also have geometrical meaning :
 |  |  |
Here is the first problem,
1/ Refered to the diagram below :

Two tangent lines formed at points a and b on an ellipse intersect at point c. Point o is the center of the ellipse. Show that the line oc bisects line ab at m.
Set the center of the ellipse point o,
Input 3 : o = gpt(0,0)
Ans. set o = 0, 0, 0
Reference to ellipse parameters diagram, suppose we uses a = 5 and b = 3, then the parameters of the conic section will be A=1/25, B=0, C=1/9, D=0, E=0, F=-1, so we create the ellipse el,
Input 4 : el = gconic(1/25,0,1/9,0,0,-1)
Ans. set el = 5, 0, 0, 0, 0, 5, 3, 0.04, 0, 0.111, 0, 0, -1
The first element of the list is 5 and this means that el is an ellipse.
To create points a and b, one simple way is to use the polar representation. The x and y coordinates of a point on an ellipse is given by the following formula :
x = a cos (φ)
y = b sin (φ)
First, we create two random angles between 0 to pi :
Input 5 : q = random(2,0,1800)/10*pi/180
Ans. set q = 0.79, 2.93
Uses these two random angles, we create two random points a and b on ellipse
Input 6 : a = gpt(5*cos(q(0)),3*sin(q(0)))
Ans. set a = 0, 3.523, 2.129
Input 7 : b = gpt(5*cos(q(1)),3*sin(q(1)))
Ans. set b = 0, -4.89, 0.639
To create tangent lines at point a and point b, we uses the function 'tline' :
Input 8 : la = tline(a,el)
Ans. set la = 1, 149.21, 4.228
Input 9 : lb = tline(b,el)
Ans. set lb = 1, 70.03, 14.08
The intersection point of la and lb is point c :
Input 10 : c = intersect(la,lb)
Ans. set c = 0, -2.943, 5.982
The line ab is,
Input 11 : ab = gline(a,b)
Ans. set la = 1, 10.046, 1.504
The line co is,
Input 12 : co = gline(c,o)
Ans. set co = 1, 116.2, 0
Therefore, the intersection point m is :
Input 12 : m = intersect(ab,co)
Ans. set m = 0, -0.681, 1.384
To verify m bisects line ab, we measure the distance am and mb :
Input 13 : distance(a,m)
Ans. 4.27
Input 14 : distance(m,b)
Ans. 4.27
Since both distances are the same, m bisects ab. This completed the verification. Finally, we plot all the above objects in a graph,
Input 15 : draw('el|a|b|c|o|la|lb|ab|m|co|ab',-7,7,0.1,-7)
Ans. OK
The resulting graph is :

Next, we try to verify a theorem called 'three tangents theorem'.
2/ Refered to the diagram below :

Points a, b and c are tangent points of the non-degenerate conic. Tangent lines of a and b meets at point r. Tangent lines of a and c meets at point p. Tangent lines of b and c meets at point q. The lines bp, aq and cr are concurrent at point o.
Although the theorem is valid for all non-degenerate conic section, we only verify this theorem with parabola. First we create a parabola.
With reference to the parabola parameters diagram, we set A=0, B=0, C=1, D=-4, E=0 and F=0
Input 16 : clear()
Input 17 : el = gconic(0,0,1,-16,0,0)
Ans. set el = 7, 0, 0, 0, 0, 0, 4, 0, 0, 1, -4, 0, 0
The first element's value is 7, so el is a parabola. The equation for el is y2 = 4 x.
To create three points on the parabola, we create three random numbers for the y values of the points ranged between -10 to 10. Then, from the equation of el, we can calculate the x values.
Input 18 : r=random(3,-100,100)/10
Ans. set r = 7.2, -6.9, -10
Therefore, points a, b and c are,
Input 19 : a = gpt(r(0)*r(0)/4,r(0))
Ans. set a = 0, 12.96, 7.2
Input 20 : b = gpt(r(1)*r(1)/4,r(1))
Ans. set b = 0, 11.9, -6.9
Input 21 : c = gpt(r(2)*r(2)/4,r(2))
Ans. set c = 0, 25, -10
Create the tangents by function 'tline' :
Input 22 : la = tline(a,el)
Ans. set la = 1, 15.52, 3.6
Input 23 : lb = tline(b,el)
Ans. set lb = 1, 163.84, -3.45
Input 24 : lc = tline(c,el)
Ans. set lc = 1, 168.69, -5
The three intersection points p, q and r are,
Input 25 : p = intersect(la,lc)
Ans. set p = 0, -18, -1.4
Input 26 : q = intersect(lb,lc)
Ans. set q = 0, 17.25, -8.45
Input 27 : r = intersect(la,lb)
Ans. set r = 0, -12.42, 0.15
The lines bp, aq and cr are,
Input 28 : bp = gline(b,p)
Ans. set bp = 1, 169.58, -4.71
Input 29 : aq = gline(a,q)
Ans. set aq = 1, 105.33, 54.48
Input 30 : cr = gline(c,r)
Ans. set cr = 1, 169.58, -4.71
To check for concurrent of lines bp, aq and cr, we check the interection point from two lines bp and aq and the intersection point from lines aq and cr.
Input 28 : intersect(bp,aq)
Ans. 0, 17.086, -7.853
Input 29 : intersect(aq,cr)
Ans. 0, 17.086, -7.853
Since both intersection points are the same, we can conclude that lines bp, aq and cr are concurrent.
Finally, we plot the items of the above objects on a graph :
Input 30 : draw('el|a|b|c|p|q|r|la|lb|lc|bp|aq|cr',-1,23,0.1,-12)
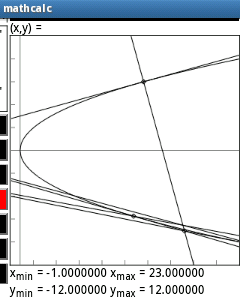
This graph only shows some of the objects but it can be seen that an intersection point exists as a meeting points from three lines.
No comments:
Post a Comment
Note: Only a member of this blog may post a comment.